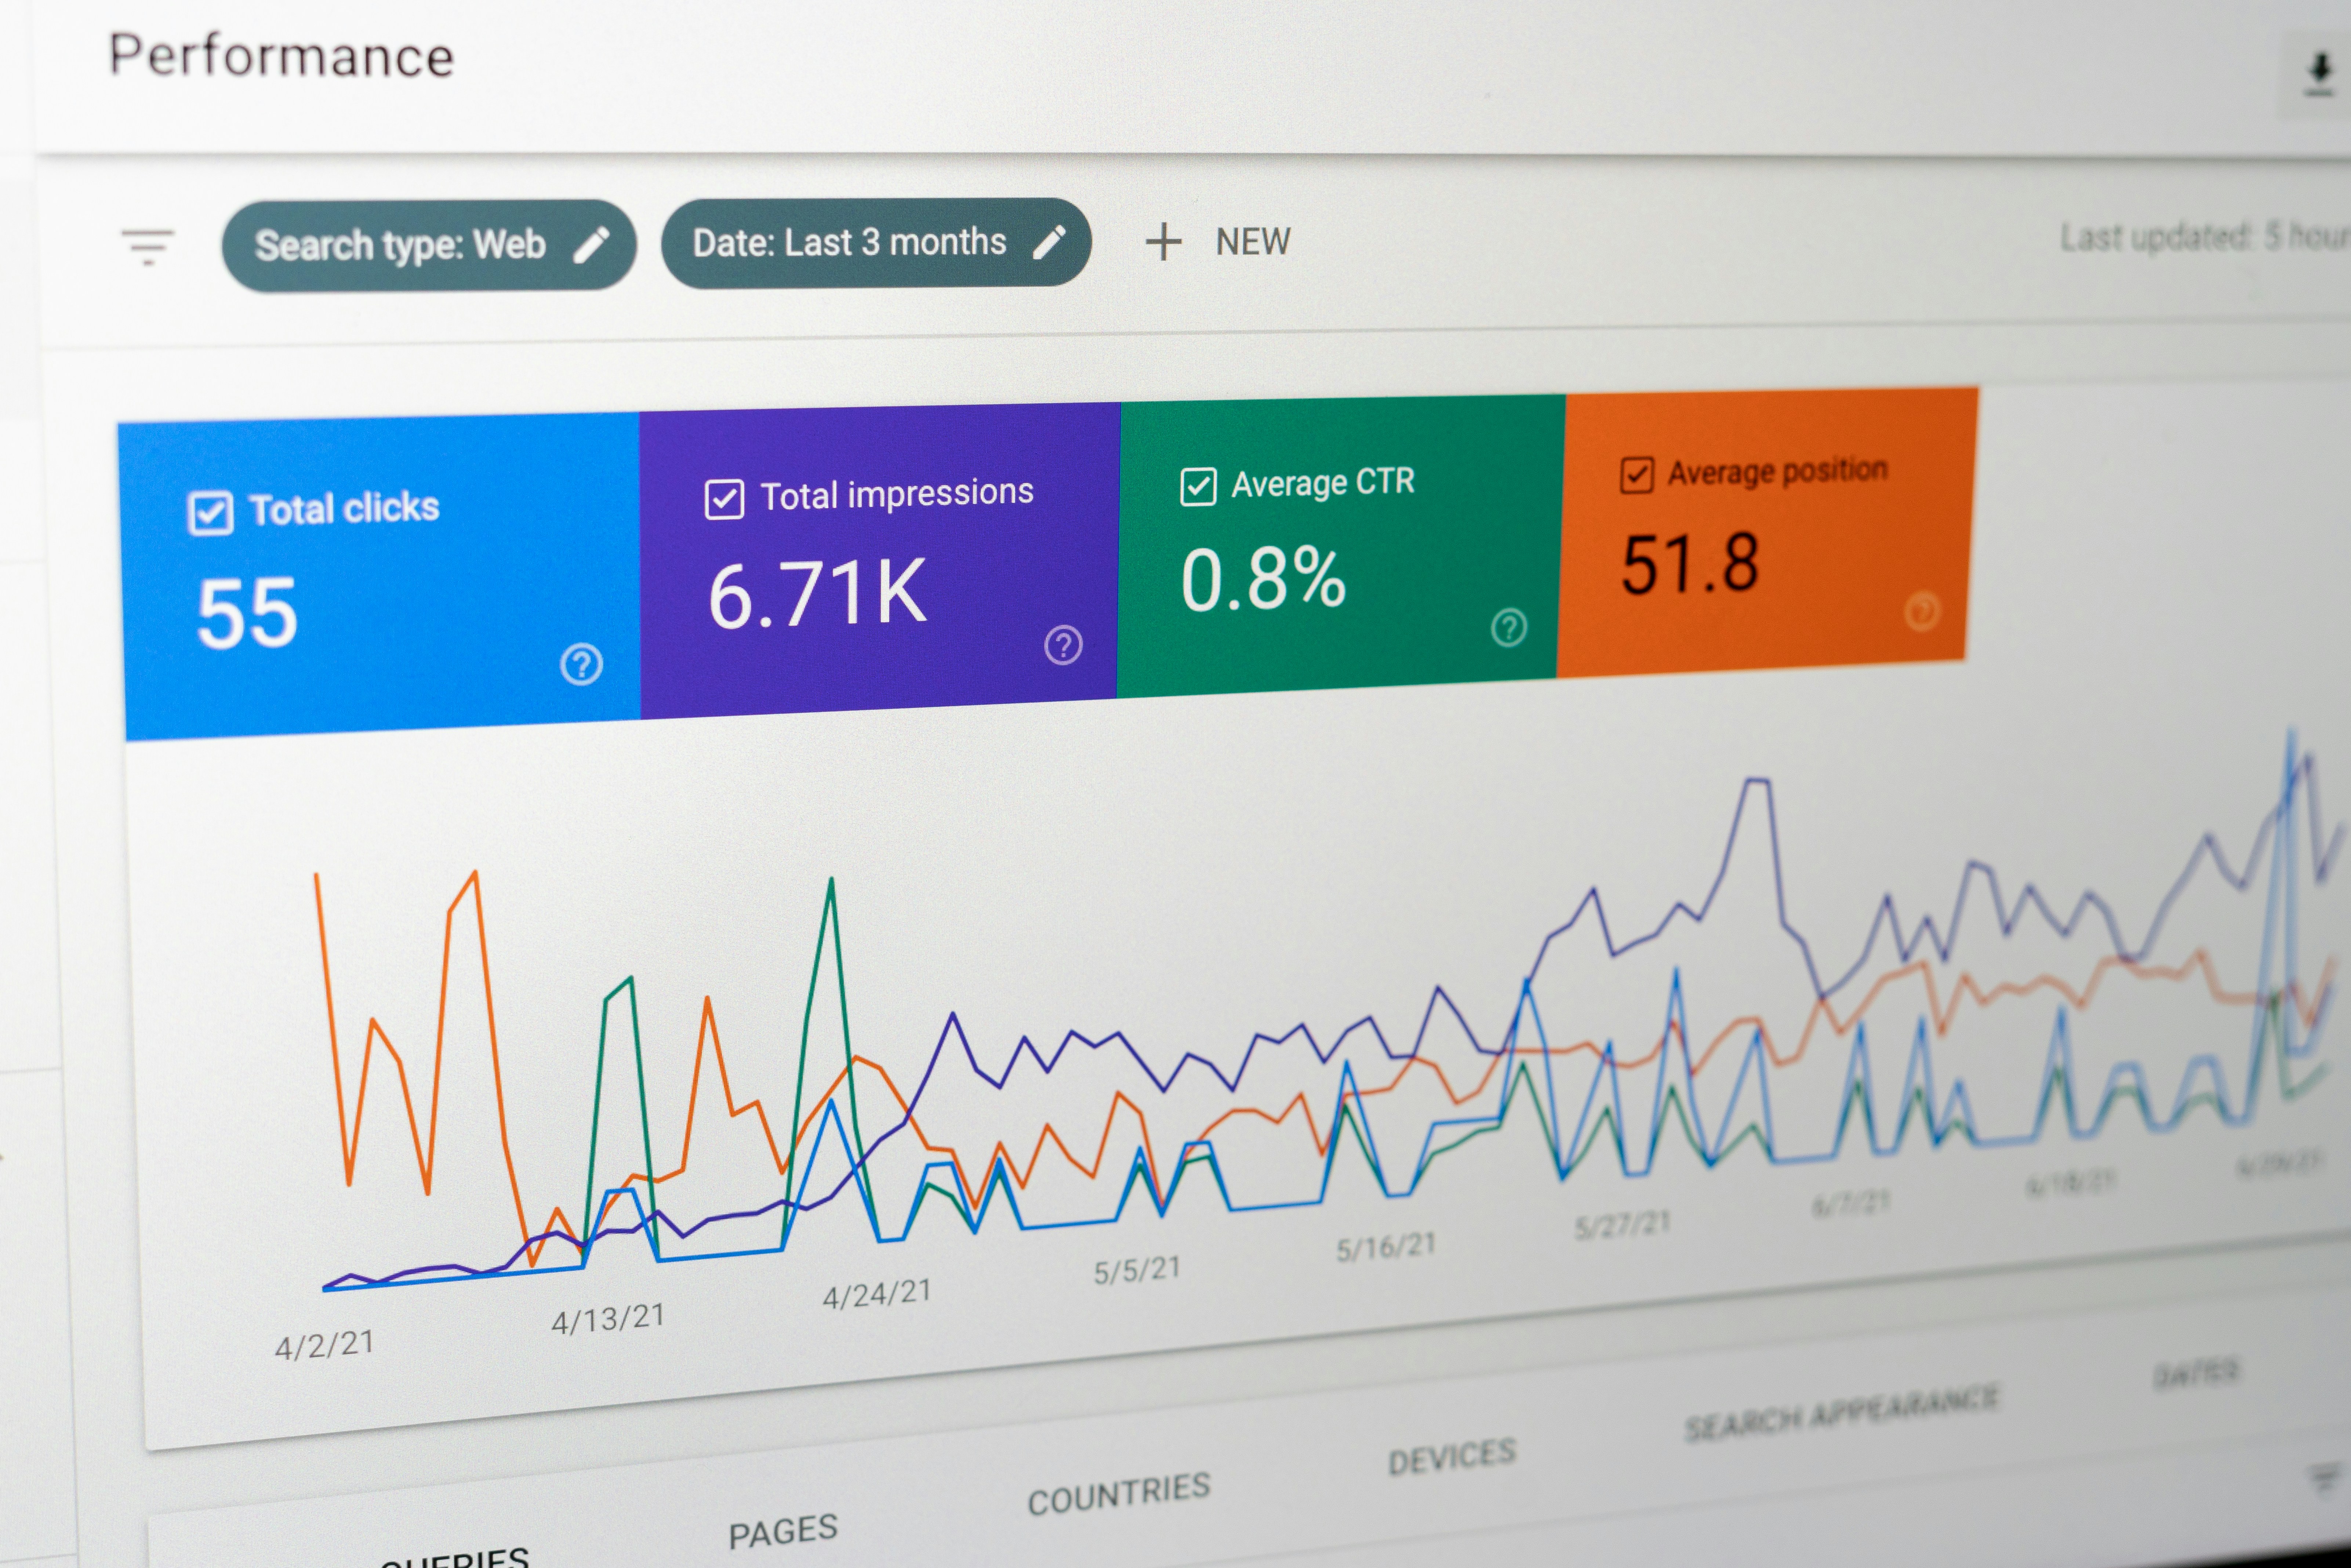
Understanding Business Intelligence Dashboards
Business intelligence (BI) dashboards are powerful tools that provide organizations with a visual representation of key performance indicators (KPIs) and other relevant data metrics. Their primary purpose is to enable decision-makers to analyze vast amounts of information quickly and intuitively, promoting informed choices that enhance operational effectiveness and strategic planning. Unlike traditional reporting mechanisms, which often present data in static formats such as spreadsheets, BI dashboards leverage data visualization techniques to present insights dynamically. This approach allows users to interact with data, drilling down into specifics or viewing trends over time.
The core functions of business intelligence dashboards encompass data visualization, real-time monitoring, and support for decision-making processes. By integrating various data sources, these dashboards synthesize information into comprehensive visual formats, such as graphs, charts, and heat maps. This facility ensures that stakeholders can access the latest data at their fingertips, facilitating proactive responses to shifting business environments. Real-time monitoring enables organizations to track operational metrics as they occur, allowing for swift corrective action if necessary, thus minimizing the impact of potential issues.
There are three primary types of business intelligence dashboards: operational, strategic, and analytical, each serving distinct purposes within different business contexts. Operational dashboards focus on monitoring real-time performance indicators that help businesses manage day-to-day operations effectively. Strategic dashboards are designed for higher-level executives, consolidating long-term, forward-looking metrics to guide organizational direction. Conversely, analytical dashboards delve deeper into historical data analysis, helping organizations identify trends and patterns for informed forecasting. By utilizing the appropriate type of dashboard, organizations can harness the full potential of business intelligence, turning data into actionable insights for sustained growth.
Key Features of Effective Business Intelligence Dashboards
Effective business intelligence dashboards serve as crucial tools for organizations seeking to leverage data for informed decision-making. One of the primary characteristics of a proficient dashboard is its user-friendly design. A well-organized layout ensures that users can easily navigate through data visualizations and access pertinent information without unnecessary complexity. Intuitive interfaces reduce the learning curve for users, promoting broader adoption across teams.
Another essential feature is customizable views. Organizations often have unique metrics and key performance indicators (KPIs) that they prioritize; therefore, the ability to tailor the dashboard to meet specific user requirements significantly enhances its functionality. Customization allows users to focus on the data most relevant to their roles, improving productivity and ensuring that critical insights are readily accessible.
Integration capabilities are also vital. An effective business intelligence dashboard should seamlessly connect with various data sources, such as CRM systems, ERP software, and databases. This interoperability ensures that users can pull in diverse data streams, thereby enriching their analyses and leading to more comprehensive insights. When data is aggregated from multiple sources, decision-makers can identify correlations and trends that may not have been evident when analyzing isolated datasets.
Interactive elements enable users to engage with the data more profoundly. Features such as drill-down capabilities allow users to explore underlying data points for a more granular perspective. This interactivity fosters a more dynamic understanding of the data, empowering users to conduct exploratory analysis directly from the dashboard.
Moreover, mobile accessibility is a significant asset. With more professionals working remotely or on-the-go, having access to business intelligence dashboards on mobile devices enhances flexibility and responsiveness. Users benefit from real-time updates and notifications, which are critical for timely decision-making.
Finally, the importance of data accuracy cannot be overstated. Reliable dashboards must present real-time updates to ensure that decision-makers have access to the most current and accurate information available. This promotes confidence in the insights derived from the data, ultimately contributing to more effective and reliable decision-making.
Best Practices for Designing Business Intelligence Dashboards
Creating impactful business intelligence dashboards requires adherence to several best practices that enhance their usability and effectiveness. One of the foremost principles is simplicity. A dashboard that is cluttered with excessive information can overwhelm users, making it challenging to extract insights effectively. Designers should aim for a clean interface that prioritizes essential data points, ensuring that the most crucial information is front and center. This approach allows users to quickly grasp key metrics without sifting through unnecessary details.
Clarity is another critical design principle. Employing coherent and straightforward labeling for graphs, charts, and KPI indicators ensures that users understand exactly what they are viewing. Each visual element should convey a single idea, which helps prevent misinterpretation of the data. Additionally, consistent color schemes and font choices will contribute to a professional look while reinforcing brand identity. The use of intuitive icons can enhance user experience by aiding in data comprehension significantly.
An essential aspect of designing effective dashboards is the selection of appropriate visualizations. Different types of data require distinct representation formats; for instance, trends are best displayed through line charts, while comparisons can be effectively portrayed using bar graphs. Understanding the audience’s needs and behavior can guide the choice of visual elements, making the data more accessible and actionable. Incorporating user input during the design phase is vital. Gathering feedback ensures that the dashboard aligns with specific business requirements, ultimately increasing user adoption and satisfaction.
Moreover, templates should be viewed as starting points rather than final solutions. Continuous evaluation and iteration post-deployment allow for adjustments based on user interactions and evolving business objectives. Regular updates to the dashboard content and structure will keep the information relevant, thereby supporting informed decision-making processes in an ever-changing business landscape.
Real-World Applications and Success Stories
Business intelligence (BI) dashboards have proven instrumental across various sectors, enabling organizations to distill vast amounts of data into actionable insights. One noteworthy example is a leading retail chain that faced challenges in inventory management. By implementing a BI dashboard, the company gained real-time visibility into stock levels, allowing them to optimize their supply chain processes. As a result, they increased their inventory turnover rate by 25% within six months, showcasing the significant benefits of a tailored dashboard solution.
Similarly, the healthcare industry has also embraced business intelligence dashboards for improved operational efficiency. A prominent hospital implemented a dashboard to track patient flow and resource allocation. By visualizing key metrics, such as admission rates and bed occupancy, hospital administrators could make informed decisions regarding staffing and equipment usage. The implementation of this dashboard not only enhanced patient care but also led to a 15% reduction in operational costs, demonstrating the critical role of BI tools in healthcare management.
Moreover, in the financial sector, a multinational bank utilized business intelligence dashboards to monitor and analyze customer behaviors and transaction trends. This real-time analytical capacity enabled them to tailor financial products to meet customer demands effectively. The bank reported a 20% increase in customer satisfaction scores along with a 30% boost in cross-selling success rates, underscoring the transformative impact of BI dashboards on business performance.
In the manufacturing domain, a prominent automotive company leveraged BI dashboards to analyze production metrics and supply chain efficiency. By integrating real-time data from various departments, they identified bottlenecks and streamlined operations, resulting in a 40% increase in production efficiency. These success stories illustrate the diverse real-world applications of business intelligence dashboards, emphasizing their potential to drive measurable outcomes in various industries.
